MMQGIS
Michael Minn (http://michaelminn.com)
7 December 2012
Describes use of MMQGIS, a set of Python vector map layer plugins for Quantum GIS
Introduction
This README is for deprecated MMQGIS version v2012.12.07, which is the last version that works with the old vector API in QGIS 1.8. This version of MMQGIS is no longer supported and upgrade to QGIS 1.9/2.0 (Master) is highly recommended. The README for the current version of MMQGIS is HERE...
MMQGIS is a set of Python plugins for manipulating vector map layers in Quantum GIS (QGIS), an open source geographic information system. While not offering a complete or profound set of new capabilities, MMQGIS does offer some useful tools missing from native QGIS or common plugin sets available as of this writing.
This document also includes a very basic introduction to writing plugins for QGIS using Python.
Caveats
Many of these functions perform import from and export to CSV files using the standard Python CSV file interface functions, which only support 8-bit character sets. Accordingly, MMQGIS will not support import from or export to UTF-8 or Unicode files. Files should be converted to an 8-bit character set prior to import.
References are occasionally made to fTools, a set of advanced spatial analysis plugins for QGIS that you will likely find useful if you use QGIS for anything other than the most trivial mapping applications. The package is free and small and installation is highly recommended.
MMQGIS is free software and is offered without guarantee or warranty. You can redistribute it and/or modify it under the terms of version 2 of the GNU General Public License (GPL v2) as published by the Free Software Foundation (www.gnu.org). Bug reports or suggestions are welcome at the e-mail address above, but I cannot promise a prompt or mutually satisfactory resolution.
MMQGIS has been partially incorporated into Sextante. If you attempt to install MMQGIS after installing Sextante, you may get the error "module' object has no attribute 'classFactory." This should be fixed in future versions of Sextante, but if you are still getting this error and want to have both MMQGIS and Sextante, you should uninstall Sextente, install MMQGIS and reinstall Sextante.
Installation
Contributed Repository: MMQGIS is included in the "official" QGIS Contributed Repository of plugins. From the QGIS Python Plugin Installer (Plugins dropdown, Fetch Python Plugins, Repositories tab), click the button to "Add 3rd Party Repositories". Installation of MMQGIS will then be automatically installed by the plugin installer.
Manual Install If, for some reason, you do not wish to use the QGIS plugin installer, MMQGIS can be installed manually with the instructions below. QGIS and the associated packages for using Python plugins. On Fedora distros, those packages are:
	Python
	Qt
	PyQt
	PyQt-devel
	PyQt4-devel
	QGIS
	QGIS-python
On Debian distros, the packages are:
	qgis
	python-qgis
	python-qgis-common
	pyqt-tools
	pyqt4-dev-tools
Download the current version of MMQGIS HERE.
Unpack the zip file and move the mmqgis directory of files to the mmqgis plugin directory:
	unzip mmqgis.zip
	mv mmqgis ~/.qgis/python/plugins
Optionally, you may install MMQGIS in the shared system plugin directory if want to share the installation with other users on a multiuser system or simply do not want extra files clogging your /home directory
Enable MMQGIS by starting qgis and using the manage plugins utility (Plugins -> Manage Plugins). The utility pops up a list box of all available plugins and you should select the checkbox beside MMQGIS. After clicking OK, an MMQGIS option should be available on the PLUGINS dropdownn menu.
Python Library Problem: On some distros (as of this writing), the QGIS python library (qgis-python) is not installed in a way that makes it accessible to QGIS, so the plugins might not be visible from the Plugins dropdown. This can be fixed by setting up a symbolic link from the expected library name to the version of the library that is installed. (reference):
sudo ln -s /usr/lib/libqgispython.so.1.0 /usr/lib/libqgispython.so
Version History
v2012.12.07
Replace QgsRenderer with
QgsRendererV2 in animation tools (legacy renderer unsupported in Windoze, V2 unsupported in Linux)
v2012.10.25
__init__.py syntax error
v2012.10.19
Add urllib.quote() to Google geocode to handle non-ASCII address characters
v2012.08.28
mmqgis_select() uses unicode() instead of str() for string conversions
Upgrade street geocode to be able to use start/end x/y from layer geometries
v2012.05.10
Minimum qgis version now 1.4
Add exception handling in grid dialog for crs functions new to qgis 1.7 and 2.0
New tool: Geometry Convert
v2012.05.06
New tools: Animate Rows, Animate Columns, Delete Columns, Float to Text
text_to_float handles numbers with comma separators
Hub distance now calculated in meters, Km, feet or miles using QgsDistanceArea
mmqgis_library functions now return error message rather than creating error message box
mmqgis_library functions now all have addlayer parameter
v2012.04.06
Catch CSV sniffer errors in attribute join, Google geocode, and geocode streets
Change qt.4 legacy menu activated() to triggered()
Add submenus to facilitate future additions
v2012.01.11
Add Hub Lines tool
Add Delete Duplicate Geometries
v2011.11.12
Sort by attribute sorts int and float columns numerically
v2011.10.08
Commented out debug lines - causing "Bad file descriptor" error on Windoze
v2011.10.07
Fixed bug in raster color map - slightly better interpolation algorithm
v2011.10.06
Added is_float() tester for import geometry
Add explicit qgis parameter for mmqgis_read_csv_header()
Add notes for lack of UTF-8 and Unicode
Add direction for sort
Remove google geocode print debug line 494
Replace color_ramp /tmp directory with mkstemp()
v2011.09.14
Replace all str() with unicode() in mmqgis_dialogs.py to handle non-ASCII characters.
v2011.08.27
Add delimiter and line terminator options to export attributes and export geometry
Change attribute join text encoding from utf-8 to iso-8859-1 (M$-Windoze charset)
CSV attribute and geometry export character coding iso-8859-1
Fix case sensitivity in attribute join duplicate field name correction
v2011.08.22
Bug fix - unicode text handling in join attributes and export geometry
v2011.08.16
Bug fix - disable plugin removes menu entries - mmqgis_menu.unload()
v2011.07.30
Bug fix - bad shape ID on import geometries of points
Add error handling for CSV import delimiter sniffer exceptions
New grid types: rectangular polygon, diamond and hexagon
v2011.03.14
Add export / import geometries to / from CSV
v2011.01.21
Modify mmqgis_label_point() to use unicode() rather than str() for point labeling
v2011.01.08
Add to Official QGIS repository
v2010.09.29
- Added color map
- Added Google (tm) geocode
- Extensive internal reorganization of code
- Created mmqgis_library.py
v2010.01.02 - Added hub distance and select tools
v2009.09.04 - Added text to float tool
v2009.09.01 - Added merge layers tool
v2009.08.28 - Initial public release
Animate Tools
Animate Columns
|
|
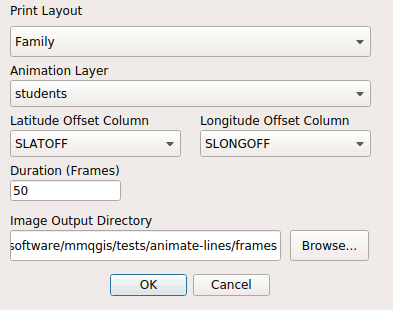
The Animate Columns tool permits animation of map features in a single layer. The objects are moved over the specified Duration number of frames in a straight line based on the offsets specified in the Latitude Offset Column and Longitude Offset Column. Individual PNG images for each frame are written to the specified Image Output Directory
The motion is specified with offsets rather than absolute X/Y values to permit animation of lines and polygons. The offsets must be specified in the Coordinate Reference System of the layer being animated. Offsets for points may be calculated by:
	offset_long = (end_long - start_long)
	offset_lat = (end_lat - start_lat)
Images are sized with the main window and are exported using the QgsmapCanvas::saveAsImage() function. This does not permit access to the layout capabilites of the map composer, so any ornamentation (ex. north arrow, labels) must be placed on the main map using map features.
Images may be combined into a single animated GIF using Gimp.
Images may be combined into video files using the mencoder program that comes with mplayer. For example, the following creates a 15 FPS silent MPEG4 file in an AVI container:
mencoder mf://*.png -mf w=640:h=480:fps=15:type=png -ovc lavc -lavcopts vcodec=mpeg4:mbd=2:trell -oac copy -o output.avi
Animate Rows
|
|
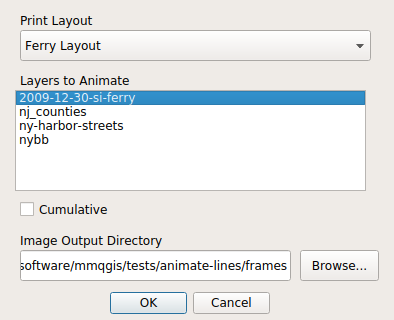
The Animate Rows tool permits animation of map features in one or more layers. The features are moved by plotting successive rows in each layer selected in the Layers to Animate list box. The Cumulative checkbox causes features from previous rows to remain on the map. Individual PNG images for each frame are written to the specified Image Output Directory
If multiple layers are being animated simultaneously, the timing of rows in each layer will be the same. There is no capability for interpolating, frame skipping or frame duplication between layers of dissimilar length. If there are fewer rows in one animated layer than in another animated layer, no features from the shorter layer will be displayed after all rows in the shorter layer have been displayed.
If text display of timing is desired, a layer must be created with a column that has the desired display text, and that layer must be mapped with features labeled.
As with Animate Columns, images are sized with the main window and are exported using the QgsmapCanvas::saveAsImage() function. This does not permit access to the layout capabilites of the map composer, so any ornamentation (ex. north arrow, labels) must be placed on the main map using map features.
Images may be combined into a single animated GIF using Gimp.
Images may be combined into video files using the mencoder program that comes with mplayer. For example, the following creates a 15 FPS silent MPEG4 file in an AVI container:
mencoder mf://*.png -mf w=640:h=480:fps=15:type=png -ovc lavc -lavcopts vcodec=mpeg4:mbd=2:trell -oac copy -o output.avi
Create Tools
Create Grid Layer
|
|
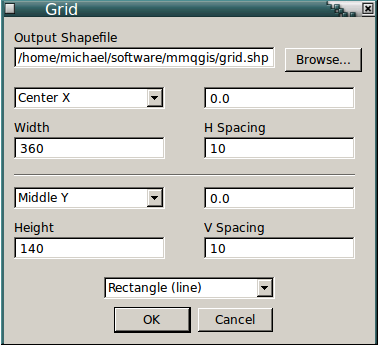
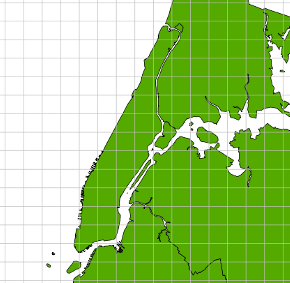
QGIS lacks a native tool for displaying a lat/long grid, so the MMQGIS grid tool creates a line shapefile containing grid lines.
The grid location is specified based on an X value of left, center or right, and a Y value of top, middle, or bottom, as specified in the dialog combo boxes.
The width/height of the area to cover with gridlines, and the horizontal/vertical spacing of the gridlines are also specified in the dialog.
The defaults when the dialog is brought up are set to cover the full extent in the project coordinate reference system of the current display that is active when the plugin is invoked.
The grid is saved to a shapefile specified in the "Output Shapefile" form field.
The Grid Type combo box at the bottom of the dialog allows selection of four types of grids:
- Rectangular (line): Creates longitude and latitude lines.
- Rectangular (polygon): Creates longitude and latitude lines as adjacent rectangular polygons. The attributes for each polygon are for the center point.
- Diamond (polygon): Creates a grid of adjacent diamonds. The attributes for each polygon are for the center point.
- Hexagon (polygon): Creates a grid of hexagons. To maintain equilaterality, the ratio between the horizontal and vertical spacing is fixed (and different). Changing horizontal spacing will automatically change vertical spacing, and vice versa. The attributes for each polygon are for the center point.
fTools also has a vector grid tool (Tools -> Research Tools -> Vector grid), although the fTools gridline placement is specified based on the outer edges (min/max x/y) rather than from a central point. Specifying from a central point with MMQGIS may be useful when drawing a grid relative to some specific location.
Create Label Layer
|
|
QGis does not permit individual formatting or placement of dynamically generated feature lables. It is possible to add attribute columns to the feature for setting various "data defined" formatting and positioning parameters, although these can be a bit cumbersome to use if you simply want to drag a few lables to new positions or delete some existing labels.
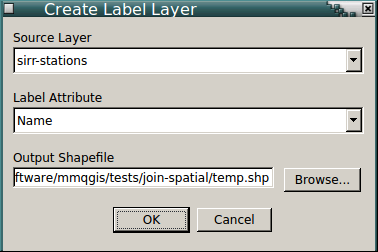
The create label layer tool provides a way to work around this deficiency by creating a point layer with unique attribute values from an existing vector layer. Those points can then be labeled and moved at will.
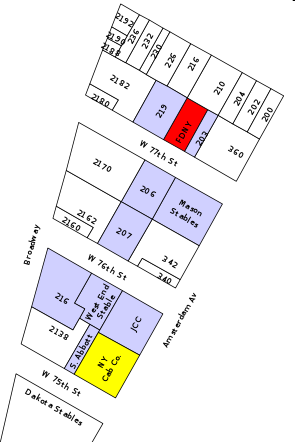
The QGis labeling mechanism also does not provide a facility for conveniently eliminating duplicate labels when multiple features are used to represent a single geographic entity (such as multiple segments of a single street). The create label layer tool overcomes this problem by creating points only for unique label names. The attributes of each point are the attributes for the first feature encountered in the source table, although the placement of the point is determined by a coordinate average of the centers of all features which have that label.
The create label layer tool has a single dialog box that permits specification of the source vector layer, the attribute that should be used for determining unique label text, and a box for the output shapefile. The label layer will be automatically added to the map, but the user will need to adjust the properties of the layer to set the attribute that is used for labeling. Additional points can be added to support multiline labels.
If some labels need to be individually tweaked for characteristics other than placement (such as formatting, rotation, font size, bolding, etc.), attribute columns will need to be added to the point layer that can be used to specify data defined label characteristics.
Note that if the source data does not have a problem with numerous redundant labels, a better approach than using this tool may be to simply add additional attribute columns to the source data for data defined positioning, formatting, etc. Use of this tool breaks the dynamic linkage between data and labels, so that labels will have to be manually adjusted to reflect changes to the underlying source data.
It is possible to perform a similar task using the fTools polygon centroids tool. However, that tool does not work with line or point layers and does not deal with the problem of redundant labels on multi-feature entites.
Hub Distance
|
|
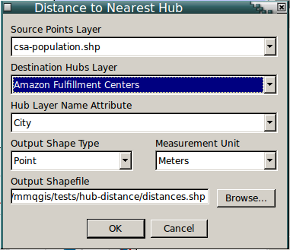
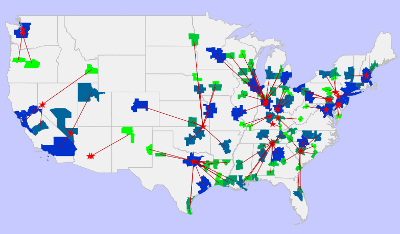
The hub distance tool iterates through each feature on the source points layer and finds the closest "hub" from the destination hubs layer based on Ellipsoidal distance. The output is a shapefile containing all the attributes from the source layer along with a distance field and the name of the hub based on an attribute selected in the Hub Layer Name Attribute box.
The output shapefile can be either points (one for each source point) or lines from the source points to the closest hubs.
Distances can be specified in the units selected in the Measurement Unit combo box. No attempt is made to transform between coordinate systems, so using source and hub layers with different coordinate systems may yield odd and undesirable results. Distances are calculated with the QgsDistanceArea class, which does an ellipsoidal calculation.
When "Layer Units" is selected, the units in the Coordinate Reference System of the source layer are used to calculate Euclidian distance is used. In these cases may also be helpful to use a projected coordinate system in linear units (i.e. not degrees) that will yield meaningful linear distances for the distance field.
This tool does not incorporate any kind of network analysis, so if paths to hubs are non-linear (e.g. when dealing with city blocks), the closest Euclidian distance may not be the closed in terms of traveling distance.
Hub Lines
|
|
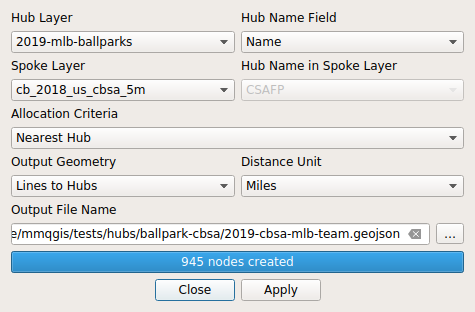
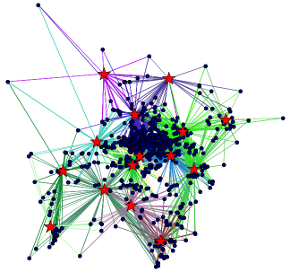
The hub lines tool creates hub and spoke diagrams with lines drawn from points on the "Spoke Point" layer to matching points in the "Hub Point" layer. Determination of which hub goes with each point is based on a match between the "Hub ID Attribute" on the hub points and the "Spoke Hub ID Attribute" on the spoke points.
The lines are output to a shapefile of lines and each line inherits all attributes from the matching spoke points.
No attempt is made to transform between coordinate systems, so using source and hub layers with different coordinate systems may yield odd and undesirable results. This tool also does not incorporate any kind of network awareness (e.g. as when dealing with streets between city blocks), and all lines are straight lines from spoke to hub.
Voronoi Diagram
|
|
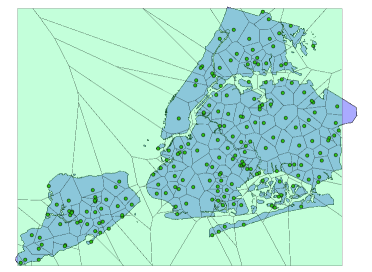
A Voronoi diagram is a collection of polygons, each surrounding individual points and representing the area around each point that is closer to that point than any other. The shapes are named after Russian mathematician Georgy Fedoseevich Voronoi, who published a formal definition in 1908, but the concept of this type of polygon extends back to Descartes in the 17th century. Similar polygons were famously used by physician John Snow to trace the source of a London cholera epidemic in 1854 and Voronoi diagrams remain useful in GIS for analyzing areas of influence associated with individual points within a collection.
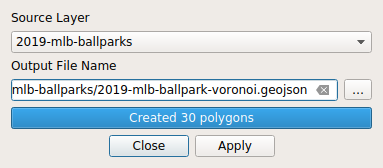
The Voronoi diagram tool requires a point layer and outputs a polygon shapefile with the option to add it to the map. The boundary of the Voronoi diagram is the min/max extent of the points in the source layer.
The algorithm used to calculate the edges and nodes starts with tangents at the midpoints of lines between each point. The closest tangent is assumed to be a border and intersections to the border are calculated to circle each border until back to the beginning. The algorithm is computationally intensive, but still seems to run fairly quickly on a reasonably small set of points.
Modify Tools
Color Map
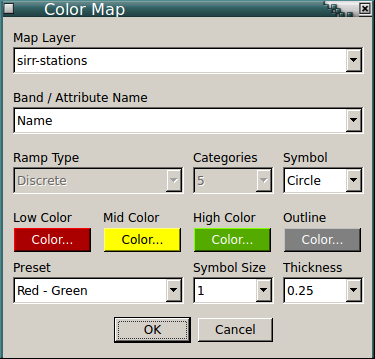
The color map tool permits assignment of a continuous gradation of customized symbology colors to "graduated symbol" vector layers. Color maps can also be assigned to raster layer values. This tool is needed because (as of this writing) QGIS only provides one default blue-green color ramp when using automated classification, necessitating time-consuming individual modification of colors when different ranges of colors are desired.
The range of values is computed from the data when a band/attribute is selected, and this operation may take a few seconds if the layer data is large. An midpoint is selected using the arithmetic median of the high and low values, and this midpoint may be changed to skew the color distribution when values are clustered in the higher or lower portions of the range. Color presets are provided, although custom colors may be selected by clicking on the "Color..." buttons. Intermediate colors are computed using linear interpolation of the individual red/green/blue values.
Delete Columns
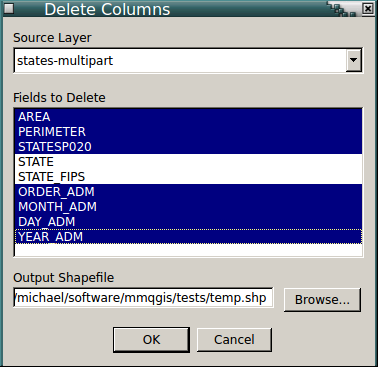
As of this writing, Qgis does not allow the deletion of columns from shapefiles. The Delete Columns tool permits this action by saving all columns except selected columns from a layer into a new shapefile.
Delete Duplicate Geometries
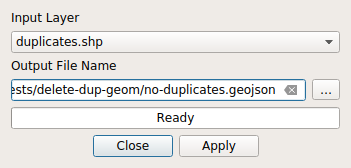
The Delete Duplicate Geometries tool removes duplicates shapes from a layer as it saves that layer to a shapefile. Two shapes are considered duplicates if their geometries are exactly identical, as determined by the QgsGeometry equals() function. Attributes are not considered, only geometry.
To improve speed, this tool loads all geometries into memory - which may cause memory issues with large datasets or large numbers of complex polygons.
Float to Text
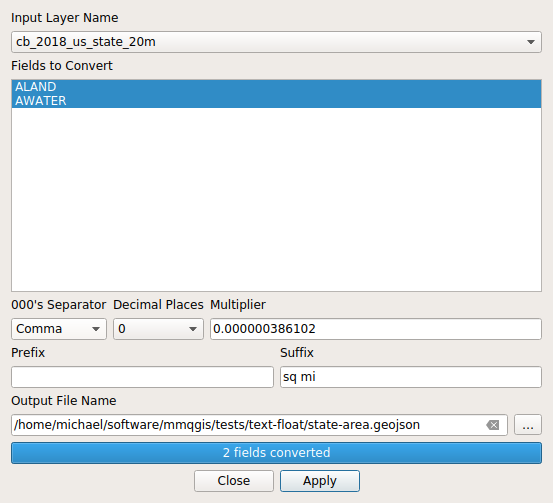
As of this writing, QGis does not have a feature for number formatting when numeric values are used to label features. The Text to Float tool converts integer and floating point values to strings, with the ability to specify thousands separators, the number of decimal digits, prefixes and suffixes (eg. dollar sign prefix or "miles" suffix). This is the opposite of the "Text to Float" tool.
The Source Layer dropdown is used to select the layer containing the attributes for conversion. The Fields to Convert selection box is used to select the attributes to be converted. Multiple fields may be selected. The Output Shapefile box selects the name of the file where the converted records will be written.
Geometry Convert
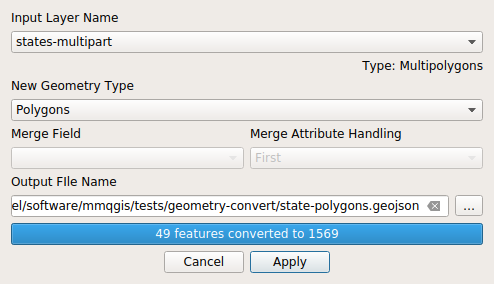
The Geometry Convert tool changes the geometry types of shapes.
- All shapes other than points can be converted to centroids or individual node points
- Multi-part shapes (multi-point, multi-line, multi-polygon) can be decomposed to individual parts (point, line, polygon, respectively)
- Polygons and multi-polygons can be converted to lines
- Shapes with elevation (2.5-D) are converted to X/Y (2-D). This can be helpful for converting GPS or KML layers to 2-D for merging with other 2-D layers (elevation is discarded)
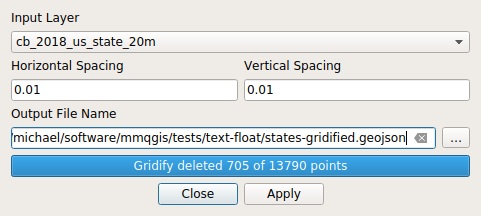
Gridify
|
|
The gridify tool permits simplification of points, lines and polygons in a shapefile by aligning all vertices to a specified grid and then removing redundant points. This makes it possible to significantly improve display refresh time when working with shapefiles that are more detailed than is necessary for the final map. However, the gridification process can result in some odd artifacts when viewed at higher resolutions, particularly in dealing with coves and other appendages along the edges of larger polygons.
The alignment grid is specified with horizontal and vertical spacing. Defaults are based on 0.5% of the extent of the target layer. The gridified shapes are saved to a shapefile specified in the "Output Shapefile" form field.
Sort
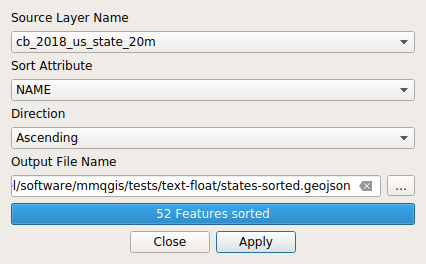
Shapefile attributes are stored in DBase format files (.dbf), which can be veiwed and edited in external programs like OpenOffice. However, the ordering of the data in the .dbf file may not be optimal, but if the .dbf data is reordered without reordering the associated shapes, the data will be associated with the wrong shapes, making it useless.
The sort tool permits sorting of attribute data and associated shapefile data to maintain alignment. Sorting is based on a single attribute column and the result of the sort is saved to a shapefile specified in the Output Shapefile box.
Text to Float
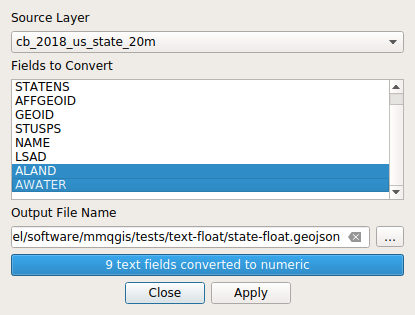
Numeric values may be stored as text strings in shapefiles, making it impossible to use them for symbology values. The Text to Float tool converts string attributes to floating point.
The Source Layer dropdown is used to select the layer containing the attributes for conversion. The Fields to Convert selection box is used to select the attributes to be converted. Multiple fields may be selected. The Output Shapefile box selects the name of the file where the converted records will be written.
Care should be exercised in selecting fields since fields containing strings that cannot be converted to floating point (e.g. strings with non-numeric characters) will be assumed to have a value of zero. When selected, integer fields are converted to floating point, which should result in no loss of precision but may increase shapefile size.
Transfer Tools
Attributes Export to CSV File
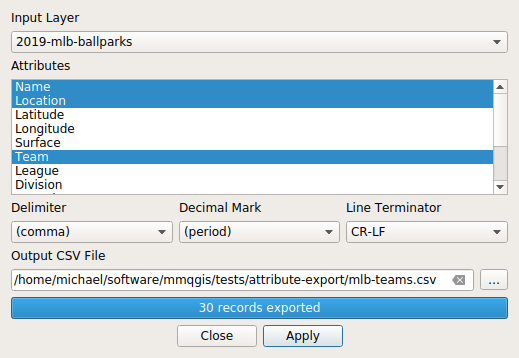
The export attributes tool saves attributes from a map layer to a .csv file, which can then be viewed or edited. This can be helpful when you have some use for the attribute data without the asssociated geographic data. When dealing with data sets that have large numbers of rows or columns, viewing or searching exported data can be simpler or faster than the QGIS open attribute table, which can be unacceptably slow with large data sets.
A multiple-selection list box on the dialog permits selection of the attribute columns to export to a .csv file specified at the bottom of the form.
Attribute Join from CSV File
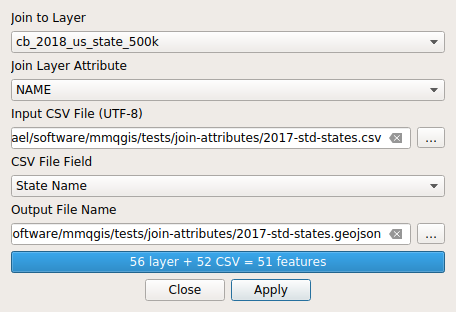
The join attributes tool permits import of attributes from a .csv file based on a join using a "key" field that is present both in the .csv file and in the attribute table of the map layer to which the data is being joined. The key is specified by selection boxes for CSV File Field and Join Layer Attribute and do not have to have the same name. The join is similar to an SQL join and if there are multiple occurances of a key in the CSV or map layer, there will be multiple combinations of the data in the output shapefile.
A box is also provided to specify the file where unmatched records from the .csv file are saved for further analysis.
Note that because CSV files contain no reliable type data in the header, data is always imported from CSV files as text. Text columns can be converted to numeric (floating point) using the "Text to Float" tool.
Geocode from Google
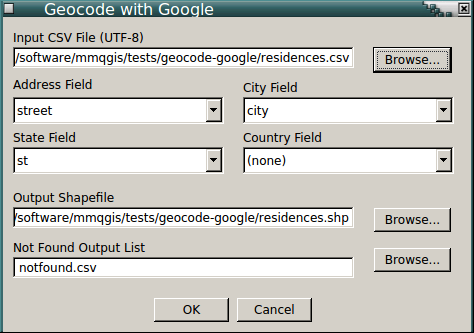
The Geocode from Google tool imports addresses from a CSV file and uses the Google Maps (tm) API to geocode those addresses. The result is a point shapefile that is added to the current map, along with a CSV file containing all rows that could not be geocoded (for whatever reason). All columns from the input CSV file are added as attributes in the output shapefile. Addresses may be spread across as many as four different columns (street, city, state, country - which are concatenated for the query), although only one meaningful column is absolutely required (such as for a city/state combination).
If your CSV address data uses non-ASCII characters, it should be encoded in UTF-8 to be compatible with the Google API. Data encoded in character sets like Windoze's ISO-8859 will likely not be geocoded.
Use of this plugin requires an active internet connection. Google places both rate and volume restrictions on the number of addresses that can be geocoded within various time limits. You should visit Google's Google Geocoding API page for more details, current information and Google's terms of service.
Geocode from Street Layer
|
|
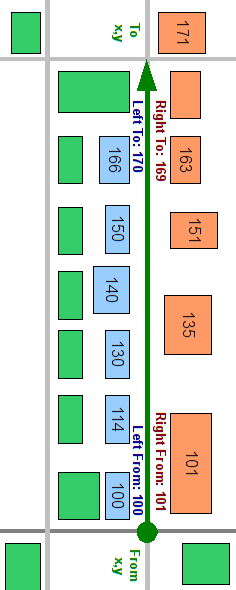
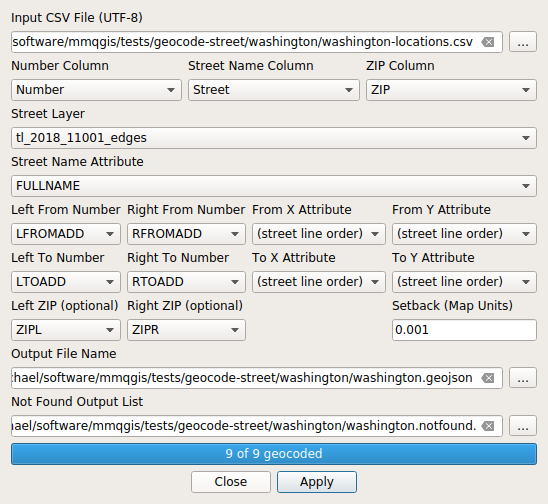
The street address geocoding tool requires a layer with street centerline features and attributes indicating the range of addresses associated with each feature.
The street centerline layer should have attributes for FROM x/y and TO x/y (in map coordinates), a range of addresses on the left side, and a range of addresses on the right side.
Optionally, an attribute selector is given to permit the FROM/TO x/y from the shape lines themselves can be used ("street line start" and "street line end"). However, this assumes that the order of line vertices in the shapefile consistently starts with FROM or TO points, which may not be true and which may result in inconsistently geocoded locations.
Shapefiles created as ESRI "address locators" can be used with this geocoder, but newer version file geodatabases and older Access geodatabases cannot be used because these proprietary formats are not supported by QGIS. MapInfo tables are supported and can be used if these are provided as an alternative. An example of a street centerline shapefile is the New York City Department of City Planning's DCPLION.
Addresses (along with other attributes) are read in from a .csv file. Addresses should be in a single attribute field (number and street together) that can selected once an input CSV file is selected. The attributes columns from the street centerline layer can also be selected, although when a layer is selected, the dialog will attempt to find columns with appropriate names.
The character encoding of the .csv file should match the character encoding of the street centerline file. Note that as of this writing, shapefile attributes are generally internally encoded UTF-8, regardless of the actual character encoding of the underlying DBF file. So, UTF-8 .csv files should work with this tool and the tool will throw an error message if it encounters a fatal encoding mismatch.
The "Building Setback" indicates how far the geocoded points should be set away from the street centerline (i.e. how far buildings are from the middle of the street, in map units).
As with many tools of this type, the matching and interpolation is quite fragile. Street names in the street layer must match the names in the CSV file exactly - "First Street" will not match "1st street". The tool will also only handle address street numbers that are entirely numeric - "172-10 Seventh Ave." or "1872a Main" will throw fatal errors.
Output is a new point shapefile and a .csv file listing which addresses were not matched.
Geometry Export To CSV
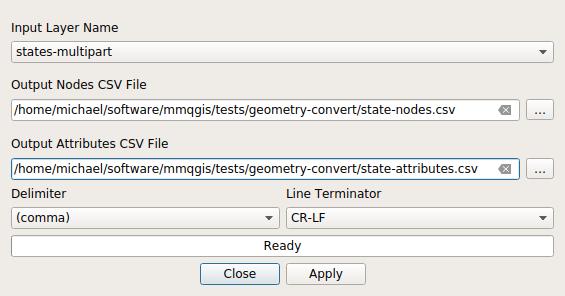
Geometry Export to CSV exports points, polylines or polygons to comma-separated variable (CSV) files.
For point layers, the output CSV file includes an "x" column, a "y" column, and a "shapeid" column in addition to all attributes associated with each point.
For polyline and polygon layers, individual nodes of each shape are given a separate row in the output file. Nodes for each shape have the same "shapeid" value. Node lines are written in the same sequential order that nodes occur in the shape. Attributes for each shape are exported to a separate CSV file, with a "shapeid" column referencing the associated nodes in the node CSV file.
Geometry Import From CSV
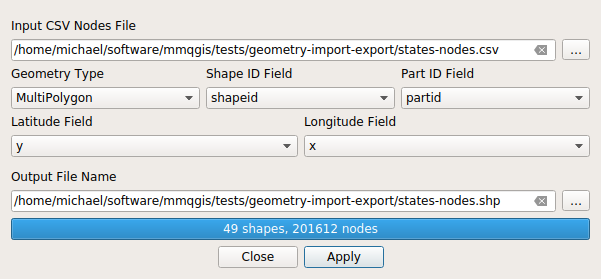
Geometry Import From CSV imports points, polylines exports points, polylines or polygons to comma-separated variable (CSV) files. A combo box is provided to indicate whether the nodes from the CSV file should be imported as discrete points, as lines or as polygons.
For point layers, only a single input CSV file is needed that includes latitude and longitude columns. All other columns are imported as attributes. This is essentially the same as the "Add Delimited Text Layer" native QGis command. Attributes are always imported as text strings and if columns need to be converted to integer or floating-point types, the MMQGIS "Text to Float" command should be used.
For polyline and polygon layers, individual nodes of each shape should be provided on separate rows in an input CSV node file. The file should have three columns: Latitude, Longitude, and Shape ID. Any additional columns will be ignored. Nodes for each shape should have the same unique Shape ID value and should occur in the file in the same sequence that they will be added to the shape.
If the imported polylines or polygons have additional attributes to be imported, they should be placed in a separate CSV file with a Shape ID column to join to the imported nodes using the MMQGIS "Attributes Join From CSV File" command.
Other than providing a compliment to the "Geometry Export To CSV" command, this command can be used to import transit "shapes.txt" data from General Transit Feed Specification (GTFS) releases by transit agencies.
Type errors such as non-numeric latitude/longitude or ambiguous CSV format will usually throw a cryptic Python error.
Merge Layers
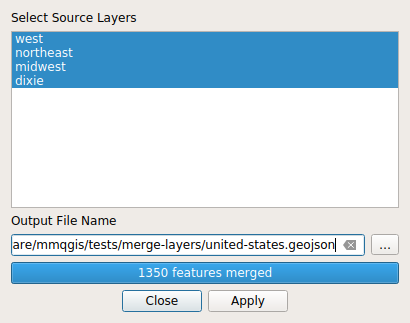
The merge layers tool merges features from multiple layers into a single shapefile and adds the merged shapefile to the project. One or more layers are selected from the "Select Source Layers" dialog list box and an output shapefile name is specified in the "Output Shapefile" dialog field.
Merged layers must all be the same geometry type (point, polygon, etc.). If the source layers have different attribute fields (distinguished by name and type), the merged file will contain a set of all different fields from the source layers with NULL values inserted when a source layer does not have a specific output field.
Select
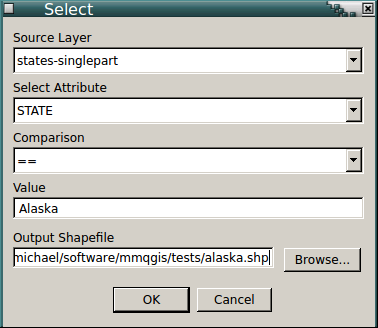
The select tool permits selection of features from a layer based on comparison to attribute values. The selection is written to a new shapefile.
While QGis provides a search feature from the attribute table dialog, invocation of that dialog requires reading the entire set of attributes into memory. As such, it will be very slow and may lock up with memory thrashing when invoked with large data sets. The mmqgis select tool overcomes this by reading and writing attributes from one feature at a time. Numeric status bar messages describe the progress of the selection operation.
The select tool can select based on a single attribute (Select Attribute) a comparison (equal, not equal, greater, greater equal, less, less equal, begins with and contains), and a user-specified comparison value. Values can be numeric or text and type conversion will be made based on the native type of the specified selection attribute. The "begins with" and "contains" comparisons are meant for strings and may give unpredictable results when applied to integer or floating-point attributes.
No capability is provided for complex selections or selection based on multiple attributes. However, is is generally possible, albeit cumbersome, to execute multiple selection operations and/or merge operations from separate output files to perform complex selections.
Simple Example Plugins
Following are two simple of examples to demonstrate how to write a Python plugin for QGIS. Serious programming of such plugins requires knowledge of the Python scripting language, the Qt user interface framework API and the QGIS programming API. However, developing plugins is a nice (albeit time-consuming) way to learn to use all three.
Simple Non-Dialog Plugin
A plugin consists of at least two files: an entry point module named __init__.py and a plugin class file.
The following is an example __init__.py file simplified from the plugin example given in the QGIS users manual. It contains six unclassed methods that give QGIS information about the plugin and a way to access the plugin class:
# -*- coding: utf-8 -*-
from demoplug import demoplug

def name():
	return "Demo QGIS Plugin"

def description():
	return "A simple demo plugin to load shapefiles"

def version():
	return "2009.08.04"

def qgisMinimumVersion():
	return "1.0"

def authorName():
	return "Michael Minn"

def classFactory(iface):
	return demoplug(iface)
The first five methods are for identification purposes. The "classFactory" method calls the constructor for the plugin class, in this case called "demoplug" and imported (at the top of the file) from the demoplug.py file. This file is as follows:
# -*- coding: utf-8 -*-
# Import the PyQt and QGIS libraries
from PyQt4.QtCore import *
from PyQt4.QtGui import *
from qgis.core import *
import os.path

class demoplug:
	def __init__(self, iface):
		# Save reference to the QGIS interface
		self.iface = iface

	def initGui(self):
		# Create action to start plugin config and connect to the run method
		icon = QIcon(os.path.dirname(__file__) + "/demoplug.png")
		self.action = QAction(icon, "Add Vector Layer", self.iface.mainWindow())
		QObject.connect(self.action, SIGNAL("activated()"), self.run)

		self.iface.addPluginToMenu("&demoplug", self.action)

		print 'Loaded demoplug'

	def unload(self):
    		self.iface.removePluginMenu("&demoplug", self.action)
		print 'Unloaded demoplug'

	def run(self):
		fileName = QFileDialog.getOpenFileName(None, \
			QString.fromLocal8Bit("Select a file:"),"", "*.shp *.gml")
		if fileName.isNull():
			QMessageBox.information(None, "Cancel", "File selection canceled")
		else:
			self.iface.addVectorLayer(fileName, "myLayer", "ogr")
The initGUI() method is called to add a Plugin menu entry and unload() is called to remove it from the menu. The run() method (which is an action called when the plugin menu item is selected) prompts the user for a shapefile (via the standard Qt open filename dialog) and then adds it as a vector laayer to the current project.
Create these two files and move them to a subdirectory that you create in the QGIS plugin directory:
	mkdir ~/.qgis/python/plugins/demoplug
	mv __init__.py demoplug.py ~/.qgis/python/plugins/demoplug
If you wish, you can also create a 24x24 pixel demoplug.png file with an icon you want to display in the menu to represent the plugin.
After starting QGIS, under the "Plugins" dropdown should be an entry to "Manage Plugins...". Scroll through the list to find demoplug and click the checkbox to enable it. This should place it in the menu so it can be run.
Dialog Plugin
Most plugins use a custom dialog box to prompt the user for information needed to perform an operation.
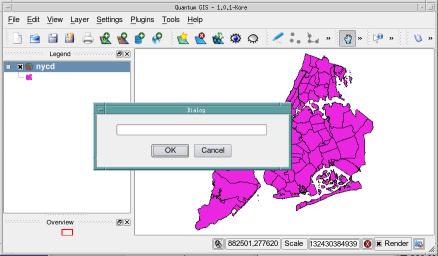
Dialog boxes can be created with direct Qt API calls, although it is easier to use the Qt designer application to lay out the dialog and use the pyuic4 compiler to create the class that can be used by a Python plugin.
For this example, the output of the pyuic4 compiler saved in a third file, mmqgisqtwidgets.py:
# -*- coding: utf-8 -*-

# Form implementation generated from reading ui file 'demoplugqtwidgets.ui'
#
# Created: Wed Aug  5 09:23:05 2009
#      by: PyQt4 UI code generator 4.4.4
#
# WARNING! All changes made in this file will be lost!

from PyQt4 import QtCore, QtGui

class Ui_demoplugqtwidgets(object):
    def setupUi(self, demoplugqtwidgets):
        demoplugqtwidgets.setObjectName("demoplugqtwidgets")
        demoplugqtwidgets.resize(384, 105)
        self.buttonBox = QtGui.QDialogButtonBox(demoplugqtwidgets)
        self.buttonBox.setGeometry(QtCore.QRect(110, 60, 160, 26))
        self.buttonBox.setOrientation(QtCore.Qt.Horizontal)
        self.buttonBox.setStandardButtons(QtGui.QDialogButtonBox.Cancel|QtGui.QDialogButtonBox.Ok)
        self.buttonBox.setObjectName("buttonBox")
        self.layerName = QtGui.QLineEdit(demoplugqtwidgets)
        self.layerName.setGeometry(QtCore.QRect(40, 20, 301, 22))
        self.layerName.setObjectName("layerName")

        self.retranslateUi(demoplugqtwidgets)
        QtCore.QObject.connect(self.buttonBox, QtCore.SIGNAL("accepted()"), demoplugqtwidgets.accept)
        QtCore.QObject.connect(self.buttonBox, QtCore.SIGNAL("rejected()"), demoplugqtwidgets.reject)
        QtCore.QMetaObject.connectSlotsByName(demoplugqtwidgets)

    def retranslateUi(self, demoplugqtwidgets):
        demoplugqtwidgets.setWindowTitle(QtGui.QApplication.translate("demoplugqtwidgets", \
		"Dialog", None, QtGui.QApplication.UnicodeUTF8))
A demoplugqt.py class file is created to use this dialog:
# -*- coding: utf-8 -*-

from PyQt4.QtCore import *
from PyQt4.QtGui import *
from qgis.core import *
from demoplugqtwidgets import Ui_demoplugqtwidgets

import os.path

# ---------------------------------------------

class demoplugqtdialog(QDialog, Ui_demoplugqtwidgets):
	def __init__(self, iface):
		QDialog.__init__(self)
		self.iface = iface
		self.setupUi(self)

# ---------------------------------------------

class demoplugqt:
	def __init__(self, iface):
		self.iface = iface

	def initGui(self):
		icon = QIcon(os.path.dirname(__file__) + "/demoplugqt.png")
		self.action = QAction(icon, "Rename Layer", self.iface.mainWindow())
		QObject.connect(self.action, SIGNAL("activated()"), self.run)

		self.iface.addPluginToMenu("&demoplug", self.action)
		print 'Loaded demoplugqt'

	def unload(self):
    		self.iface.removePluginMenu("&demoplug", self.action)
		print 'Unloaded demoplugqt'

	def run(self):
		print "Running dialog"
		layer = self.iface.activeLayer()
		if layer == None:
			QMessageBox.information(self.iface.mainWindow(), "Rename Layer", \
				"Project has no active layers")
			return

		dialog = demoplugqtdialog(self.iface)
		dialog.exec_()

		newname = str(dialog.layerName.displayText()).strip()
		if newname > "":
			layer.setLayerName(newname)
A __init__.py file is created with info on the new plugin:
# -*- coding: utf-8 -*-
from demoplugqt import demoplugqt

def name():
	return "Demo QGIS Plugin (with Qt dialog)"

def description():
	return "A simple demo plugin to rename layers"

def version():
	return "2009.08.05"

def qgisMinimumVersion():
	return "1.0"

def authorName():
	return "Michael Minn"

def classFactory(iface):
	return demoplugqt(iface)
Finally, create a subdirectory in the plugin directory and move these three files into it.
	mkdir ~/.qgis/python/plugins/demoplugqt
	mv __init__.py demoplugqt.py demoplugqtwidgets.py ~/.qgis/python/plugins/demoplugqt
If we want our children to have fish, we'd better leave some for them. (Ruth Reichl)